Overview
A/B testing is a methodology for testing product changes. You split your users into two groups, show ‘control group’ your existing product and ‘experimental group’ your new versions. By getting users’ different reactions, you could determine the better version.
What AB testing isn’t good for
A/B testing isn’t good for
-
new experiences because it may result in 1) change aversion (where users don’t like changes to the norm), 2) novelty effect (where users test out everything new)
-
knowing if you are missing something
Complimentary techniques for A/B testing
-
analyze user log to find the reason of behavior changes
-
user research, focus groups, human evaluation
A/B testing gives broad quantitative data, while other techniques give you deep qualitative data
Example of Audacity
Want to make a change to the start button color of audacity’s website.
-
Hypothesis: changing the ‘start now’ button from orange to pink will increase how many students explore Audacity’s courses
-
Metric
-
click-through rate: measure the usability(how often they find the button) \(CTR = \frac{number\space of \space clicks}{number \space of \space page \space views}\)
-
click-through probability: measure the total impact(how often they enter the second page) \(CTP=\frac{unique\space visitors\space who\space click}{unique\space visitors\space to\space page}\)
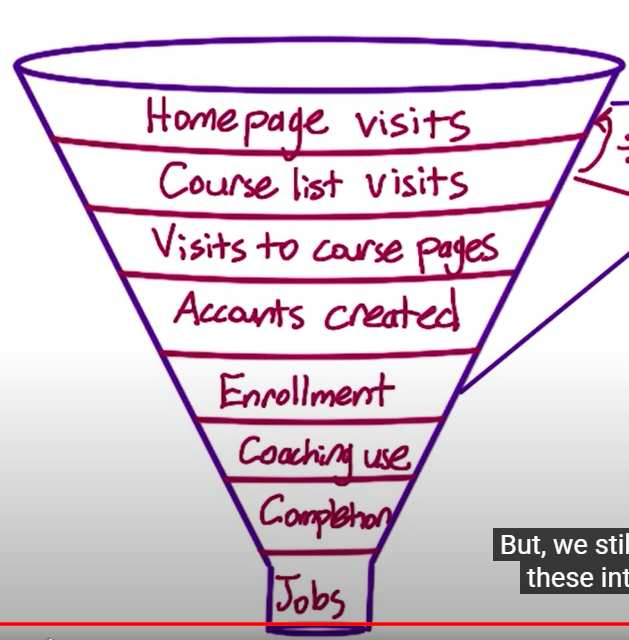
A typical user flow chart
-
-
Compute metrics
- CTR: on every page view you capture the event, and then whenever a user clicks you also capture that click event.
- CTP: match each page view with all of the child clicks, so that you count, at most, one child click per page view.
-
Use statistics to measure the experiment results
We expect CTP to follow a binomial distribution
-
Confidence Interval: \([\hat{p}-z^*\sqrt{\frac{p(1-p)}{N}}, \hat{p}+z^*\sqrt{\frac{p(1-p)}{N}}]\)
-
Hypothesis Testing: compare the two groups’ results
For comparing two samples, we calculate the pooled standard error. For e.g., suppose X~cont~ and N~cont~ are the control number of users that click, and the total number of users in the control group. Let X~exp~ and N~exp~ be the values for the experiment.
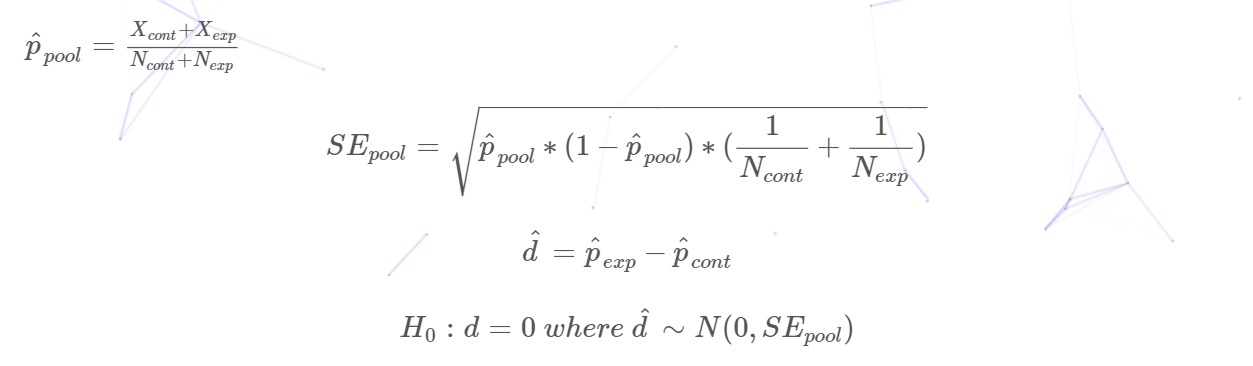
the confidence interval is:
-
-
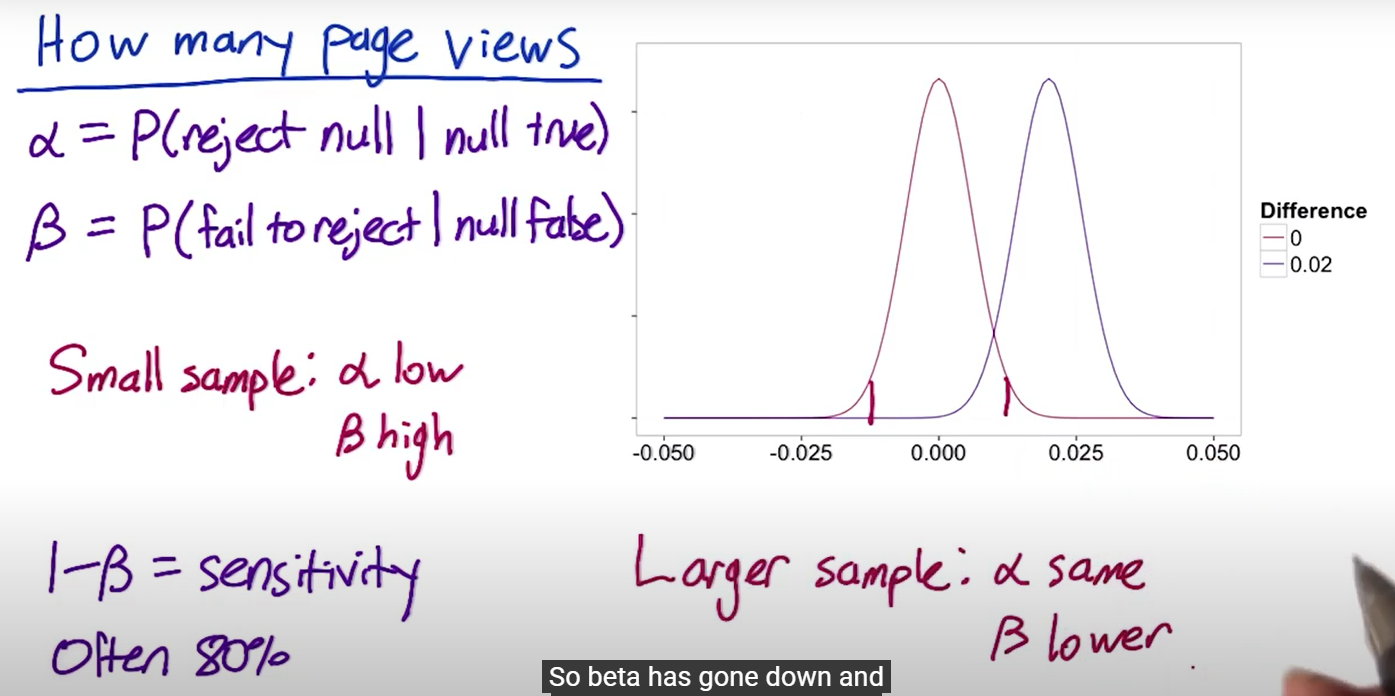
Design the experiment size (Size vs Power trade-off)
-
size vs power:
-
Increase the number of samples: α is the same, β will be lower
small size of samples: α is the same, β will be high because the hypothesis and the true distribution has a lot of area overlapped.
-
statistical power: 1−β is referred to as the sensitivity of the experiment, or statistical power. In general, you want your experiment to have a high level of sensitivity at the practical significance boundary. People often choose high sensitivity, typically around 80%.
Change Page views needed Reason Increase CTR (still <0.5) Increase this increases the standard error (p increases), and therefore, you need a higher number of samples to eliminate the increase. $SE = \sqrt{\frac{p(1-p)}{N}}$ Increase practical significance level (d~min~) decrease larger change is easier to detect thus doesn’t need too much samples Increase confidence interval (1-α) increase more conservative so that you can keep the same sensitivity Increase sensitivity (1-β) increase narrow the distribution practical significance level refers to the level of difference you care about between the control group and the experiment group.
-
-
Analyze the results
1
2
3
4
5
6
7
8
9
10
11
12
13
14
15
16
17
18
19
20
N_cont = 10072  # Control samples (pageviews)
N_exp = 9886  # Test samples (pageviews)
X_cont = 974  # Control clicks
X_exp = 1242  # Exp. clicks

p_pool = (X_cont + X_exp)/(N_cont+N_exp)
se_pool = sqrt(p_pool*(1-p_pool)*(1/N_cont + 1/N_exp))

p_cont = X_cont/N_cont
p_exp = X_exp/N_exp
d_hat = p_exp - p_cont
# d_hat = 0.02892847

m = 1.96*se_pool  # margin of error
# m = 0.0087
cf_min = d_hat-m
cf_max = d_hat+m
d_min = 0.02 # Minimum practical significance value for difference
# cf_min = 0.0202105
# cf_max = 0.03764645
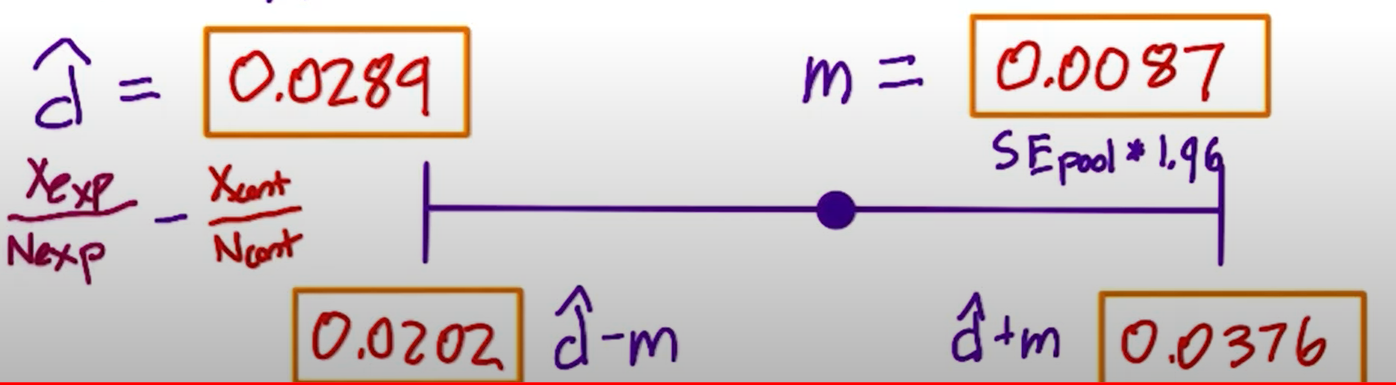
The confidence interval is [0.0202, 0.0375], which means there is at least 2.02% change at the 95% confidence level. And it is larger than the minimum practical significance value (2%). Thus we will launch the new version.
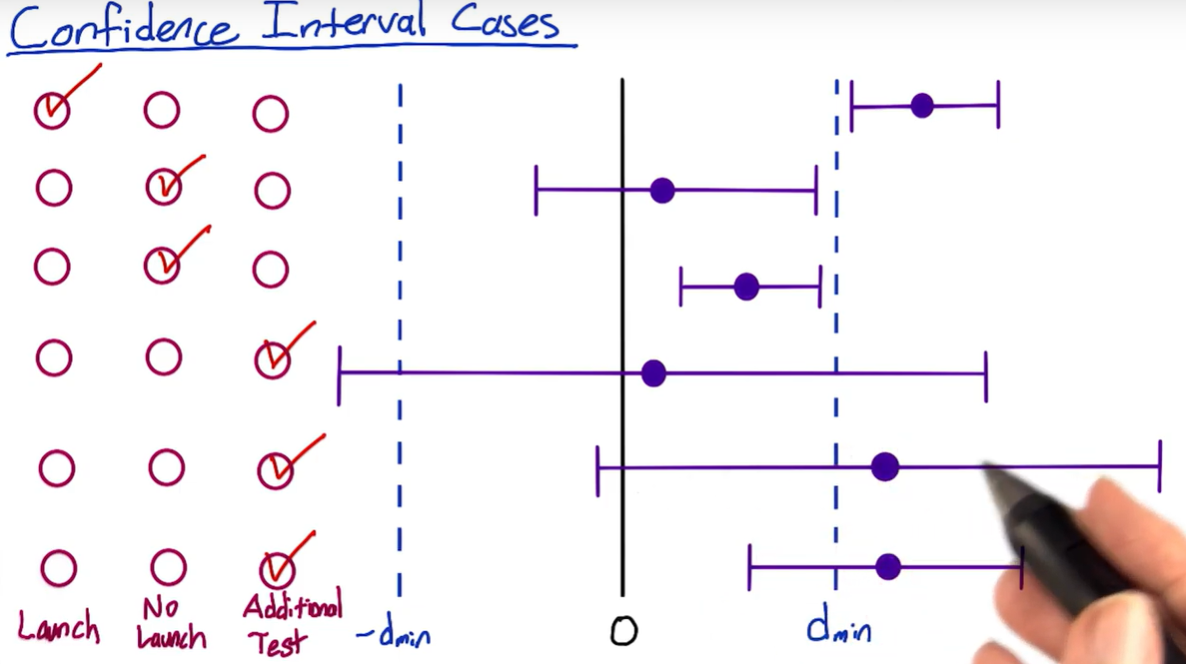
A standard case to launch the new version: The point estimate (the center of confidence interval) should exceed the practical significance value and the confidence interval shouldn’t include zero, the left boundary should exceed d~min~ as well.
Policy and Ethics for Experiments
Four Principles of IRB’s
IRB: short for Institutional Review Boards
-
Risk: What risks are participants under?
- Minimal risk is defined as the probability and magnitude of harm that a participant would encounter in normal daily life.
- If the risk exceeds minimal risk, then informed consent is required.
-
Benefit: What benefits might be the outcome of the study?
-
Choice: What other choices do participants have?
- In online experiments, the issues to consider are what the other alternative services that a user might have, and what the switching costs might be, in terms of time, money, information, etc.
-
Privacy (Data Sensitivity): what expectation of privacy and confidentiality do participants have?
- For new data being collected and stored, how sensitive is the data and what are the internal safeguards for handling that data?
- For that data, how will it be used and how will participants’ data be protected? How are participants guaranteed that their data, which was collected for use in the study, will not be used for some other purpose? This becomes more important as the sensitivity of the data increases.
- what data may be published more broadly, and does that introduce any additional risk to the participants?
- What is the re-identification risk of individuals from the data?
Internal Reviews Recommended
- Are participants facing more than minimal risk?
- Do participants understand what data is being gathered?
- Is that data identifiable?
- How is the data handled?